

What process is responsible #
We need to check what process is responsible for the increased load.
To do so:
- Run
htopor top command,htopis more user-friendly - Sort the processes according to memory usage
- in
htoppressF6and select thePERCENT_MEMoption at the left side with the arrow keys or clicking and press enter
- in
- See which process consumes most of the server’s memory
inotify-wait#
If you see a process, called inotify-wait, it belongs to our Malware Detection module, however, it is not the only Monitoring tool that we have if you feel like you can change it to AuditD which is using less resource.
- Open the Configuration menu on your BitNinja dashboard.
- Select the setting level on the left side. (server-level, server group-level, account-level)
- Select the Malware Detection module.
- Change the "File system monitor" value to "aduitd".
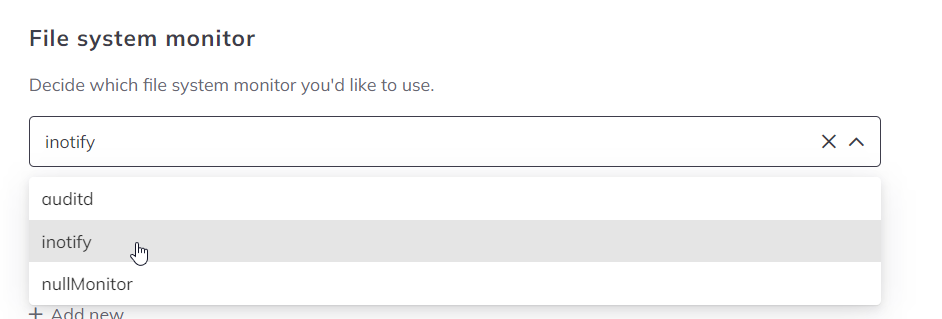
- Click on the Apply button at the top.
bitninja [MalwareDetection]#
If the process' name is bitninja [MalwareDetection] then the load is increased because:
- There are a lot of files that are being charged or created at the same time so BitNinja’s Malware detection checks all of them. Please check if you have any crons on the server that might cause a lot of files being regenerated or changed.
- If BitNinja was recently installed on the server, then our Malware detection module will only increase the load on the server for a short time, as it might be generating an indexing database of the whole filesystem.